Building Argus SOC | Phase 3 | Velociraptor DFIR and Grafana SOC Dashboard
Phase 3 of the Argus SOC build — deploying Velociraptor for live endpoint forensics and building the Grafana SOC dashboard. A real SSH brute force incident gets detected and blocked during the build.

📌 Author’s note — This post documents the Argus SOC lab at the time of publication, when the Pi 3B+ served as the MSSP edge sensor and the Pi 5 hosted the vulnerable Docker targets. The architecture was redesigned in Phase 5, which introduced a ThinkCentre M920x running Proxmox with an Active Directory lab as the client infrastructure, and moved the edge-sensor role onto the Pi 5. The detection logic, custom rules, and gap analysis described here remain valid; only the host topology has changed.
Build carried out on real hardware in a controlled home lab. Claude (Anthropic) was used as a reasoning and writing assistant — all deployments, attacks, configurations, and verifications were performed by the author.
Overview
Phase 3 adds the final two components of the live stack before red team scenarios begin. Velociraptor brings live endpoint forensics — VQL hunting queries, process inspection, and forensic artifact collection from the edge sensor. Grafana brings the visual SOC dashboard — KPI stats, alert timelines, MITRE ATT&CK coverage, top attack sources, and a global threat origin geomap, all built from real data flowing through the pipeline.
A real SSH brute force attack against the Hetzner VPS was detected and blocked during this phase — documented at the end as the first real incident handled by the stack.
Step 3.1 — Velociraptor Server on Hetzner
Velociraptor is the DFIR layer. The server runs on the Hetzner VPS and the agent runs on the Pi 3B+. During an incident, VQL (Velociraptor Query Language) queries can be pushed to the agent in real time to collect process lists, network connections, file system metadata, and forensic artifacts — without touching the endpoint directly.
1
2
3
4
5
6
7
8
9
10
11
12
13
14
15
16
# On Hetzner — download the latest binary
mkdir -p ~/velociraptor && cd ~/velociraptor

wget https://github.com/Velocidex/velociraptor/releases/download/v0.76.1/velociraptor-v0.76.1-linux-amd64 \
  -O velociraptor
chmod +x velociraptor

sudo mkdir -p /opt/velociraptor

./velociraptor config generate -i
# When prompted:
#   Datastore: /opt/velociraptor
#   GUI port: 8889
#   Frontend port: 8000
#   Output config file: /etc/velociraptor-server.config.yaml
#   Create an admin user when prompted
Create a systemd service:
1
sudo nano /etc/systemd/system/velociraptor_server.service
1
2
3
4
5
6
7
8
9
10
11
[Unit]
Description=Velociraptor Server
After=network.target

[Service]
Type=simple
ExecStart=/root/velociraptor/velociraptor --config /etc/velociraptor-server.config.yaml frontend -v
Restart=always

[Install]
WantedBy=multi-user.target
1
2
3
4
5
6
sudo systemctl daemon-reload
sudo systemctl enable velociraptor_server
sudo systemctl start velociraptor_server

# Open the agent port in UFW
sudo ufw allow 8000/tcp comment 'Velociraptor frontend'
Access the GUI via SSH tunnel from the ThinkPad:
1
2
3
ssh -L 8889:localhost:8889 root@<HETZNER_IP>
# Then open: https://localhost:8889
# Accept the browser security warning — the GUI uses a self-signed certificate, this is expected
 Velociraptor GUI — argus-edge-01 connected and reporting from the Pi 3B+
Step 3.2 — Velociraptor Agent on Pi 3B+
1
2
3
4
5
6
7
8
9
# On Hetzner — download the ARM64 binary and generate client config
wget https://github.com/Velocidex/velociraptor/releases/download/v0.76.1/velociraptor-v0.76.1-linux-arm64 \
  -O velociraptor-v0.76.1-linux-arm64

./velociraptor --config /etc/velociraptor-server.config.yaml config client > client.config.yaml

# Copy both to Pi 3B+
scp velociraptor-v0.76.1-linux-arm64 <user>@192.168.1.20:/tmp/velociraptor
scp client.config.yaml <user>@192.168.1.20:/tmp/
1
2
3
4
5
6
7
# On Pi 3B+:
sudo mkdir -p /opt/velociraptor
sudo mv /tmp/velociraptor /opt/velociraptor/velociraptor
sudo chmod +x /opt/velociraptor/velociraptor
sudo mv /tmp/client.config.yaml /etc/velociraptor-client.config.yaml

sudo nano /etc/systemd/system/velociraptor_client.service
1
2
3
4
5
6
7
8
9
10
11
[Unit]
Description=Velociraptor Client
After=network.target

[Service]
Type=simple
ExecStart=/opt/velociraptor/velociraptor --config /etc/velociraptor-client.config.yaml client -v
Restart=always

[Install]
WantedBy=multi-user.target
1
2
3
sudo systemctl daemon-reload
sudo systemctl enable velociraptor_client
sudo systemctl start velociraptor_client
In the Velociraptor GUI, argus-edge-01 should appear as connected (green) within a few seconds.
Step 3.3 — Grafana on Pi 5
Grafana runs on the Pi 5 (argus-central) and connects to the Wazuh Indexer (OpenSearch) on the Hetzner VPS to query alert data. All the detection data flowing through the pipeline — Suricata alerts, Zeek connection logs, Cowrie honeypot events — becomes queryable and visual.
1
2
3
4
5
6
7
# On Pi 5:
sudo apt install -y grafana
sudo systemctl enable grafana-server
sudo systemctl start grafana-server

# Access: http://192.168.1.10:3000
# Default credentials: admin/admin — change on first login
Step 3.4 — Open OpenSearch for Grafana
Grafana on Pi 5 needs to reach the OpenSearch API on Hetzner. Two changes required:
On Hetzner — allow the Pi 5 home IP to reach port 9200:
1
2
# Replace with your actual home public IP
sudo ufw allow from <YOUR_HOME_PUBLIC_IP> to any port 9200 comment 'OpenSearch for Grafana'
On Hetzner — allow OpenSearch to listen on all interfaces:
1
2
3
sudo nano /etc/wazuh-indexer/opensearch.yml
# Change: network.host: to network.host: 0.0.0.0
sudo systemctl restart wazuh-indexer
Step 3.5 — Add Wazuh Indexer as Grafana Data Source
In Grafana: Configuration → Data Sources → Add data source → OpenSearch
| Setting | Value |
|---|---|
| Name | Wazuh Indexer |
| URL | https://<HETZNER_IP>:9200 |
| Skip TLS Verify | Enabled |
| Basic auth | Enabled |
| User | admin |
| Password | your Wazuh admin password |
| Index name | wazuh-alerts-4.x-* |
| Time field | timestamp |
| OpenSearch version | 2.x |
Click Save & Test — should return green.
Step 3.6 — Building the Argus SOC Dashboard
Create a new dashboard. The panels below build a complete operational SOC view from the real data flowing through the stack.
Row 1 — KPI Stats
Four stat panels showing the last 24 hours at a glance:
Total Alerts (24h)
- Visualization: Stat
- Query: Lucene, empty (all alerts)
- Metric: Count
Critical Alerts (24h)
- Visualization: Stat
- Query: Lucene —
rule.level:>=10 - Metric: Count, Color: Red
Active Agents
- Visualization: Stat
- Query: Unique Count on
agent.name - Color: Green
Honeypot Logins (24h)
- Visualization: Stat
- Query: Lucene —
data.eventid:cowrie.login.success - Metric: Count, Color: Amber
Severity Distribution
- Visualization: Pie chart
- Four queries with aliases and count metrics:
rule.level:[1 TO 3]→ Low (green)rule.level:[4 TO 7]→ Medium (yellow)rule.level:[8 TO 11]→ High (orange)rule.level:[12 TO 15]→ Critical (red)
Row 2 — Alert Timeline
Alert Timeline — All Sources
- Visualization: Time series
- Query: Lucene, empty — Count, Date Histogram on
timestamp - Color: Amber
Row 3 — Intelligence Panels
These panels use PPL (Piped Processing Language) rather than Lucene. The reason:
data.srcipis mapped asiptype in OpenSearch, notkeyword— Lucene Terms aggregation cannot group by it. PPL handles this correctly.
Top Triggered Rules
1
source = wazuh-alerts-4.x-* | stats count() as alert_count by rule.description | sort - alert_count | head 10
Top Attack Source IPs
1
source = wazuh-alerts-4.x-* | where isnotnull(data.srcip) | stats count() as alert_count by data.srcip | sort - alert_count | head 10
MITRE ATT&CK Techniques
1
source = wazuh-alerts-4.x-* | where isnotnull(rule.mitre.technique) | stats count() as alert_count by rule.mitre.technique | sort - alert_count | head 10
Row 4 — Operational Panels
Recent Critical Alerts
1
source = wazuh-alerts-4.x-* | where rule.level >= 10 | fields timestamp, agent.name, data.srcip, rule.description, rule.level | sort - timestamp | head 20
Global Threat Origins (Geomap)
1
source = wazuh-alerts-4.x-* | where isnotnull(GeoLocation.country_name) | stats count() as alert_count by GeoLocation.country_name | sort - alert_count
Geomap settings:
- Layer type: Markers
- Location Mode: Lookup (not Coords)
- Lookup field:
GeoLocation.country_name - Gazetteer:
public/gazetteer/countries.json - Basemap: Carto Dark
Dashboard Settings
- Refresh: 1 minute minimum — multiple simultaneous PPL aggregation queries at faster intervals causes OpenSearch shard failures on the 4GB VPS
- Save dashboard, export JSON to
pi5-central/grafana/argus-soc-dashboard.jsonin the repo
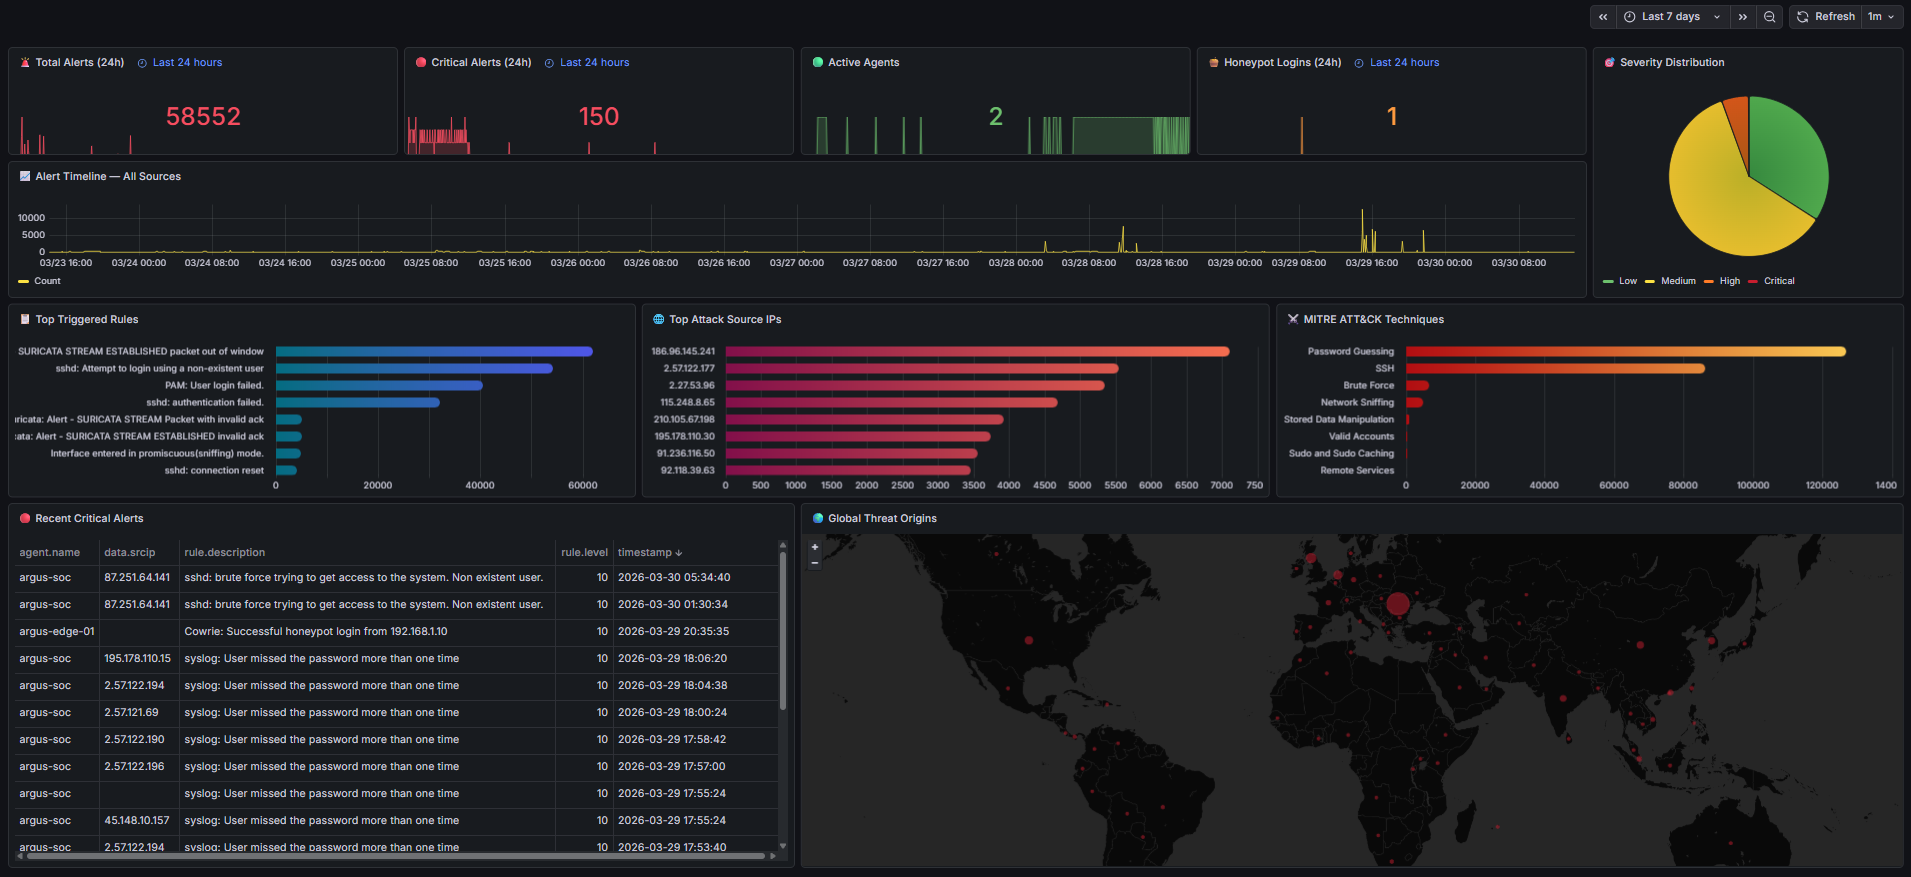 Argus SOC Grafana dashboard — live threat data across all panels including global threat origins geomap
Lessons Learned — OpenSearch and Grafana
Use PPL for IP fields. data.srcip is mapped as ip type in OpenSearch, not keyword. Lucene Terms aggregation cannot group by it — queries silently return no data. PPL handles ip type fields correctly. Any time a Grafana panel returns empty results on a field that should have data, check the field mapping in OpenSearch first.
Geomap uses Lookup mode, not Coords. GeoLocation.country_name is a keyword that maps to Grafana’s built-in country gazetteer. Coords mode requires explicit lat and lon fields — PPL cannot alias columns in the by clause to match those exact names. Use Lookup.
Refresh rate matters. Multiple PPL aggregations running simultaneously at 10s intervals will cause OpenSearch “all shards failed” errors on the CX23. 1 minute is the safe minimum for this hardware.
Add swap before building the dashboard. If you haven’t already, add 2GB swap on the Hetzner VPS — the Wazuh Indexer JVM plus simultaneous dashboard queries will push the 4GB VPS close to OOM under load.
1
2
3
4
5
sudo fallocate -l 2G /swapfile
sudo chmod 600 /swapfile
sudo mkswap /swapfile
sudo swapon /swapfile
echo '/swapfile none swap sw 0 0' | sudo tee -a /etc/fstab
Real Incident — SSH Brute Force on Hetzner
While building the Grafana dashboard, an active SSH brute force was detected against the Hetzner VPS from 87.251.64.141. The Wazuh Dashboard showed repeated authentication failures — the attacker was slow-brute-forcing to stay below fail2ban’s threshold.
Investigation confirmed passwordauthentication no was correctly set — logins were impossible regardless. The attacker was burning wordlist entries against a door that can’t open.
Response:
1
2
3
4
5
6
7
8
9
# Block the attacker immediately
sudo ufw deny from 87.251.64.141 comment 'Active SSH brute force — blocked'

# Confirm password auth is disabled
sudo sshd -T | grep passwordauthentication
# Must return: passwordauthentication no

# Check fail2ban status
sudo fail2ban-client status sshd
This was the detection-to-response loop working as designed: the dashboard surfaced the threat, investigation confirmed the attack vector, manual block closed it. Documented as the first real SOC incident handled by Argus.
Current State — Full Stack Operational
1
2
3
4
5
6
7
8
9
10
11
12
13
14
15
16
17
Hetzner VPS (argus-soc) — Helsinki
  Wazuh Manager + Indexer + Dashboard  ✅
  n8n + Claude API triage pipeline     ✅
  Velociraptor Server                  ✅

Pi 5 (argus-central) — 192.168.1.10
  Pi-hole DNS                          ✅
  WireGuard VPN Server                 ✅
  Grafana SOC Dashboard                ✅
  Metasploitable 2 + DVWA (Docker)     ✅

Pi 3B+ (argus-edge-01) — 192.168.1.20
  Wazuh Agent → Hetzner                ✅
  Suricata NIDS (eth1 SPAN)            ✅
  Zeek protocol analysis               ✅
  Cowrie SSH Honeypot (port 22)        ✅
  Velociraptor Agent                   ✅
All phases 0–3 are complete. The full pipeline is live — from packet capture on the SPAN interface through AI triage to Telegram notification, with a Grafana dashboard showing everything in real time.
What’s Next — Phase 4
Phase 4 is the red team phase. Five documented attack scenarios run from Kali Linux on the ThinkPad against the vulnerable targets on Pi 5:
- Reconnaissance — Nmap network and service discovery
- Credential Brute Force — Hydra against Cowrie
- Remote Code Execution — Metasploit vsftpd backdoor against Metasploitable 2
- Web Application Attacks — SQLmap and Burp Suite against DVWA
- Lateral Movement — pivoting from Metasploitable to Pi 3B+
Each scenario will document exactly what fired, what Claude classified it as, and what the stack missed — including honest detection gaps.
Part of the Argus SOC build series.