Building Argus SOC | Phase 0 Part 2 | Cloud SOC Platform, NIDS and Attack Range
Phase 0 Part 2 — deploying the full Wazuh stack on Hetzner, wiring up the Suricata and Zeek detection engines, and standing up the vulnerable attack targets. Phase 0 verification checkpoint passed.

📌 Author’s note — This post documents the Argus SOC lab at the time of publication, when the Pi 3B+ served as the MSSP edge sensor and the Pi 5 hosted the vulnerable Docker targets. The architecture was redesigned in Phase 5, which introduced a ThinkCentre M920x running Proxmox with an Active Directory lab as the client infrastructure, and moved the edge-sensor role onto the Pi 5. The detection logic, custom rules, and gap analysis described here remain valid; only the host topology has changed.
Build carried out on real hardware in a controlled home lab. Claude (Anthropic) was used as a reasoning and writing assistant — all deployments, attacks, configurations, and verifications were performed by the author.
Overview
With both Pis hardened, the switch SPAN configured, and the WireGuard tunnel live from Phase 0 Part 1, this post covers the other half of Phase 0: the cloud SOC platform on Hetzner, the Wazuh agent on the edge sensor, the Suricata and Zeek detection engines, and the intentionally vulnerable attack targets on the Pi 5.
By the end of this post, every component in the Phase 0 verification checkpoint is green.
Step 0.7 — Hetzner VPS and Full Wazuh Stack
Why the SOC Platform Lives in the Cloud
The central SOC platform runs on Hetzner rather than the Pi 5. The reason is architectural: a central platform sitting on home hardware can’t serve remote clients, goes offline when the power cuts out, and isn’t reachable over the internet without port forwarding hacks. The whole point of the MSSP topology is that the cloud platform is always on, always reachable, and handles any number of edge sensors reporting from different locations.
Hetzner specifically because:
- GDPR compliance — ISO 27001 certified datacenters in Finland and Germany, fully under EU law — non-negotiable for handling client security data
- x86_64 — the Wazuh Indexer (OpenSearch) only has x86_64 packages. ARM64 is not supported for the full stack
- Cost — €3.62/month for the CX23 (2 vCPU, 4GB RAM, 40GB SSD)
The Pi 5 stays as the lightweight infrastructure node — Pi-hole DNS and WireGuard server.
Server Deployment
In the Hetzner Cloud Console: create project Argus SOC, deploy CX23 in Helsinki, Finland (EU jurisdiction), Ubuntu 24.04 LTS, SSH key authentication. Set hostname argus-soc.
Initial Hardening
1
2
3
4
5
6
7
8
9
10
11
12
13
ssh root@<HETZNER_IP>

apt update && apt full-upgrade -y
apt install -y ufw fail2ban

ufw default deny incoming
ufw default allow outgoing
ufw allow 22/tcp comment 'SSH'
ufw allow 443/tcp comment 'Wazuh Dashboard'
ufw allow 1514/tcp comment 'Wazuh Agent'
ufw allow 1515/tcp comment 'Wazuh Registration'
ufw allow 55000/tcp comment 'Wazuh API'
ufw enable
Wazuh Installation
On Ubuntu 24.04 x86_64, the standard Wazuh installer works without modification:
1
2
curl -sO https://packages.wazuh.com/4.14/wazuh-install.sh
curl -sO https://packages.wazuh.com/4.14/config.yml
Edit config.yml — all components run on the same VPS so everything points to the Hetzner public IP:
1
2
3
4
5
6
7
8
9
10
nodes:
  indexer:
    - name: argus-indexer
      ip: <HETZNER_IP>
  server:
    - name: argus-manager
      ip: <HETZNER_IP>
  dashboard:
    - name: argus-dashboard
      ip: <HETZNER_IP>
1
2
sudo bash wazuh-install.sh -a
# Save the admin credentials displayed at the end — shown once only
All three services installed and started:
- Wazuh Manager ✅
- Wazuh Indexer (OpenSearch) ✅ — ~1.4GB RAM
- Wazuh Dashboard ✅ — listening on port 443
Memory Tuning
The Wazuh Indexer defaults to a 2GB JVM heap, which is too aggressive for a 4GB VPS running three services. Tune it down:
1
2
3
4
sudo nano /etc/wazuh-indexer/jvm.options
# Change: -Xms2g → -Xms1g
# Change: -Xmx2g → -Xmx1g
sudo systemctl restart wazuh-indexer
Also add swap to prevent OOM under dashboard load:
1
2
3
4
5
6
sudo fallocate -l 2G /swapfile
sudo chmod 600 /swapfile
sudo mkswap /swapfile
sudo swapon /swapfile
echo '/swapfile none swap sw 0 0' | sudo tee -a /etc/fstab
free -h  # Verify 2GB swap shows
Troubleshooting — Post-Upgrade Dashboard Failure
After a version upgrade, the dashboard stopped loading with:
1
2
Error: ENOENT: no such file or directory,
open '/etc/wazuh-dashboard/certs/dashboard-key.pem'
The upgrade renamed the certificate files. The config expected dashboard-key.pem but the files were now wazuh-dashboard-key.pem. Fixed with symlinks:
1
2
3
4
ln -s /etc/wazuh-dashboard/certs/wazuh-dashboard-key.pem \
      /etc/wazuh-dashboard/certs/dashboard-key.pem
ln -s /etc/wazuh-dashboard/certs/wazuh-dashboard.pem \
      /etc/wazuh-dashboard/certs/dashboard.pem
A second issue: the dashboard was connecting to ::1:9200 (IPv6 loopback) instead of IPv4:
1
[ConnectionError]: connect ECONNREFUSED ::1:9200
Fixed by replacing localhost with explicit IPv4 in the dashboard config:
1
2
3
sed -i 's|opensearch.hosts: https://localhost:9200|opensearch.hosts: https://127.0.0.1:9200|' \
  /etc/wazuh-dashboard/opensearch_dashboards.yml
sudo systemctl restart wazuh-dashboard
Step 0.8 — Wazuh Agent on Pi 3B+
The agent address must point to the Hetzner public IP. All telemetry goes directly over the internet to the cloud platform — not through WireGuard. This mirrors how a real MSSP edge sensor reports back to the central SOC.
1
2
3
4
5
6
7
8
9
10
11
12
# On Pi 3B+:
curl -s https://packages.wazuh.com/key/GPG-KEY-WAZUH | sudo gpg --no-default-keyring \
  --keyring gnupg-ring:/usr/share/keyrings/wazuh.gpg --import && \
  sudo chmod 644 /usr/share/keyrings/wazuh.gpg

echo 'deb [signed-by=/usr/share/keyrings/wazuh.gpg] https://packages.wazuh.com/4.x/apt/ stable main' \
  | sudo tee /etc/apt/sources.list.d/wazuh.list

sudo apt update
sudo WAZUH_MANAGER='<HETZNER_IP>' apt install -y wazuh-agent
sudo systemctl enable wazuh-agent
sudo systemctl start wazuh-agent
Verify on Hetzner:
1
sudo /var/ossec/bin/agent_control -l
1
2
3
Wazuh agent_control. List of available agents:
   ID: 000, Name: argus-soc (server), IP: 127.0.0.1, Active/Local
   ID: 001, Name: argus-edge-01, IP: any, Active
ID: 001 — Pi 3B+ reporting from home to Helsinki ✅
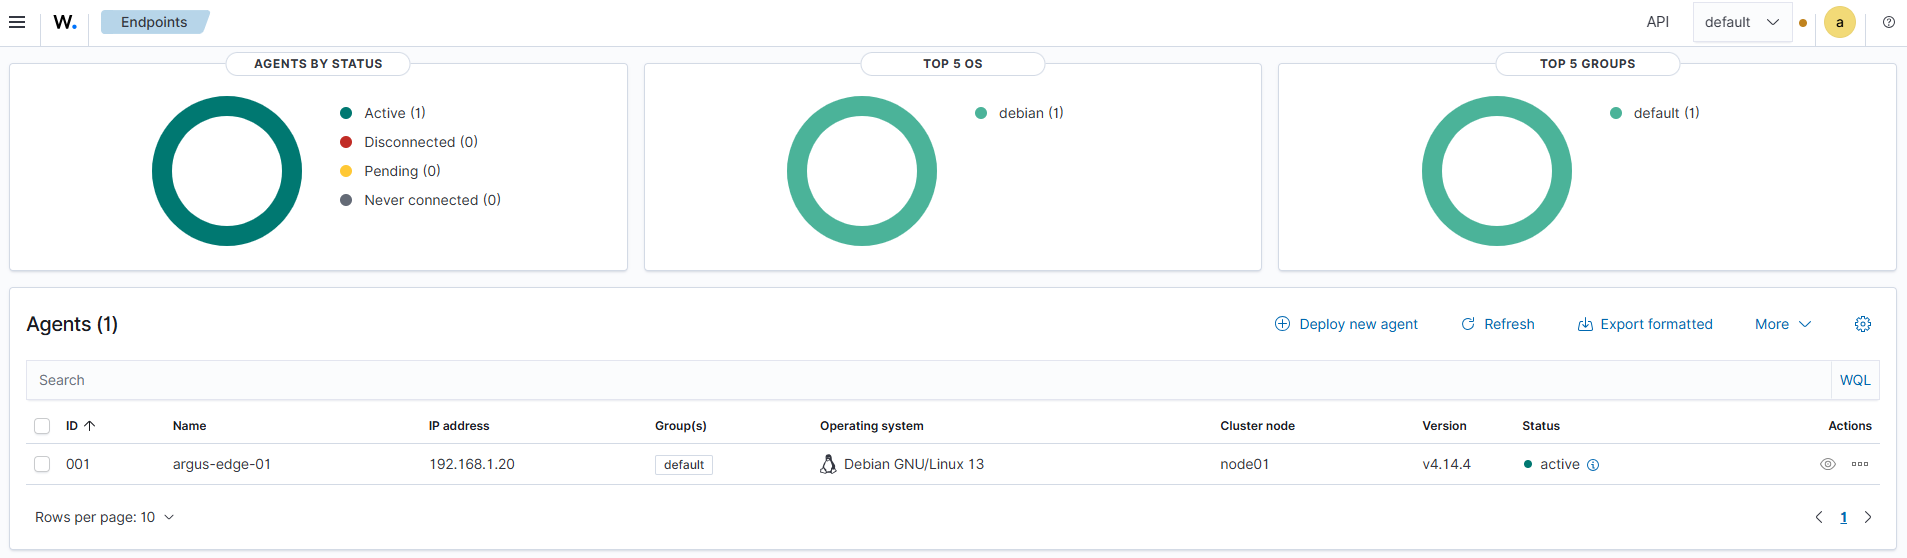 Wazuh Dashboard on Hetzner — argus-edge-01 (Pi 3B+) registered and active
Step 0.9 — Suricata NIDS on Pi 3B+
Suricata performs signature-based detection against the SPAN interface. Every packet passing through the Cisco SG300 arrives on eth1 — Suricata sees all of it.
1
2
sudo apt install -y suricata suricata-update
sudo suricata-update   # Downloads ET Open ruleset — 49,325 rules
Configuration
Key settings in /etc/suricata/suricata.yaml:
1
sudo nano /etc/suricata/suricata.yaml
1
2
3
4
5
6
7
8
9
10
11
12
13
14
15
16
17
18
19
20
21
22
23
24
25
26
27
# Set the SPAN interface
af-packet:
  - interface: eth1
    cluster-id: 99
    defrag: yes

# Set your subnet
vars:
  address-groups:
    HOME_NET: '[192.168.1.0/24]'
    EXTERNAL_NET: '!$HOME_NET'

# Memory constraints for Pi 3B+ (1GB RAM)
stream:
  memcap: 32mb
  prealloc-sessions: 1024
flow:
  memcap: 32mb
  prealloc: 1024
detect:
  profile: low

# EVE JSON output
outputs:
  - eve-log:
      enabled: yes
      filename: /var/log/suricata/eve.json
Wire Suricata into Wazuh
Add to /var/ossec/etc/ossec.conf on Pi 3B+ inside <ossec_config>:
1
2
3
4
<localfile>
  <log_format>json</log_format>
  <location>/var/log/suricata/eve.json</location>
</localfile>
1
2
3
4
sudo suricata -T -c /etc/suricata/suricata.yaml   # Test config — must return OK
sudo systemctl enable suricata
sudo systemctl start suricata
sudo systemctl restart wazuh-agent
Step 0.10 — Zeek Protocol Analysis on Pi 3B+
Zeek runs alongside Suricata on the same eth1 SPAN interface. Where Suricata does signature matching, Zeek extracts protocol metadata — connection logs, DNS queries, HTTP transactions, TLS certificates — regardless of whether any signature fired. The two tools are complementary, not redundant.
1
2
3
4
5
echo 'deb http://download.opensuse.org/repositories/security:/zeek/Debian_12/ /' \
  | sudo tee /etc/apt/sources.list.d/zeek.list
curl -fsSL https://download.opensuse.org/repositories/security:zeek/Debian_12/Release.key \
  | gpg --dearmor | sudo tee /etc/apt/trusted.gpg.d/zeek.gpg > /dev/null
sudo apt update && sudo apt install -y zeek
Configuration
1
sudo nano /opt/zeek/etc/node.cfg
1
2
3
4
[zeek]
type=standalone
host=localhost
interface=eth1
1
sudo nano /opt/zeek/share/zeek/site/local.zeek
Add:
1
2
@load policy/tuning/json-logs
redef Site::local_nets += { 192.168.1.0/24 };
1
sudo /opt/zeek/bin/zeekctl deploy
Wire Zeek into Wazuh
Add to /var/ossec/etc/ossec.conf on Pi 3B+ inside <ossec_config>:
1
2
3
4
5
6
7
8
<localfile>
  <log_format>json</log_format>
  <location>/opt/zeek/logs/current/conn.log</location>
</localfile>
<localfile>
  <log_format>json</log_format>
  <location>/opt/zeek/logs/current/dns.log</location>
</localfile>
1
sudo systemctl restart wazuh-agent
Step 0.11 — SPAN + Suricata + Zeek Verification
This is the most critical verification in the entire Phase 0 build. Without confirmed SPAN functionality, the NIDS deployment is broken regardless of how correctly Suricata is configured.
1
2
3
4
5
# From ThinkPad, ping Pi 5:
ping 192.168.1.10

# On Pi 3B+ — watch eth1:
sudo tcpdump -i eth1 -c 20 -n host 192.168.1.10
Output:
1
2
3
4
IP 192.168.1.197.58837 > 192.168.1.10.2222: Flags [.] length 0
IP 192.168.1.10.2222 > 192.168.1.197.58837: Flags [.] length 0
IP 192.168.1.197 > 192.168.1.10: ICMP echo request
IP 192.168.1.10 > 192.168.1.197: ICMP echo reply
Traffic between the ThinkPad and Pi 5 is visible on the Pi 3B+’s eth1 — not just traffic addressed to the Pi itself. Full network visibility confirmed.
Generate a port scan to verify Suricata alerts reach Wazuh:
1
2
3
4
5
# From ThinkPad:
nmap -sS 192.168.1.10

# On Pi 3B+, watch Suricata events:
tail -f /var/log/suricata/eve.json | grep -i scan
Suricata ET SCAN rules fire on the nmap scan and the events appear in the Wazuh Dashboard within seconds.
Step 0.12 — Attack Targets on Pi 5
The Pi 5 hosts the vulnerable attack targets that the red team scenarios in Phase 4 will run against. Both run in Docker containers.
Install Docker
1
2
3
4
# On Pi 5:
curl -fsSL https://get.docker.com | sh
sudo usermod -aG docker $USER
# Log out and back in for group change to take effect
Metasploitable 2
Metasploitable 2 is an x86-only image from 2012. The Pi 5 is ARM64. QEMU emulation is required — the Pi 5’s 8GB RAM absorbs the overhead without issue.
1
2
3
4
5
6
7
8
9
10
11
12
13
14
# Install QEMU x86 emulation support
docker run --privileged --rm tonistiigi/binfmt --install all

# Deploy Metasploitable 2 with x86 emulation
docker run -d \
  --name metasploitable2 \
  --network host \
  --platform linux/amd64 \
  tleemcjr/metasploitable2 \
  sh -c "/bin/services.sh && sleep infinity"

# Wait 60 seconds for services to start, then verify
nmap -sV 192.168.1.10 -p 21,22,23,80,3306 --open
# Should show vsftpd 2.3.4 on port 21 — the backdoor target for Scenario 3
DVWA
The original vulnerables/web-dvwa image doesn’t support ARM64. Use ghcr.io/digininja/dvwa with a separate MariaDB container:
1
2
3
4
5
6
7
8
9
10
11
12
13
14
15
16
17
18
19
20
21
22
23
24
25
26
27
# Create isolated network for DVWA + database
docker network create dvwa-net

# Deploy MariaDB
docker run -d \
  --name dvwa-db \
  --network dvwa-net \
  -e MYSQL_ROOT_PASSWORD=dvwa \
  -e MYSQL_DATABASE=dvwa \
  -e MYSQL_USER=dvwa \
  -e MYSQL_PASSWORD=dvwa \
  mariadb:10.6

# Deploy DVWA
docker run -d \
  --name dvwa \
  --network dvwa-net \
  -p 8080:80 \
  -e DB_SERVER=dvwa-db \
  -e DB_DATABASE=dvwa \
  -e DB_USERNAME=dvwa \
  -e DB_PASSWORD=dvwa \
  ghcr.io/digininja/dvwa

# Access: http://192.168.1.10:8080
# Default credentials: admin / password
# Click 'Create / Reset Database' on first login
Management Script
1
2
3
4
5
6
7
8
9
10
11
12
13
14
15
16
17
cat > ~/attack-targets.sh << 'EOF'
#!/bin/bash
case "$1" in
  start)
    docker start metasploitable2 dvwa-db dvwa
    echo "Attack targets started"
    ;;
  stop)
    docker stop dvwa dvwa-db metasploitable2
    echo "Attack targets stopped"
    ;;
  status)
    docker ps --filter "name=metasploitable2" --filter "name=dvwa"
    ;;
esac
EOF
chmod +x ~/attack-targets.sh
⚠️ These containers are intentionally vulnerable. Run
~/attack-targets.sh stopwhen not actively testing.
UFW rules to scope access to the lab only:
1
2
sudo ufw allow from 192.168.1.0/24 to any port 21 comment 'FTP Metasploitable - lab only'
sudo ufw allow from 192.168.1.0/24 to any port 8080 comment 'DVWA - lab only'
Phase 0 Verification Checkpoint — All Passed
| # | Check | Command | Result |
|---|---|---|---|
| 1 | Pi 5 SSH | ssh -p 2222 user@192.168.1.10 | ✅ |
| 2 | Pi 3B+ SSH | ssh user@192.168.1.20 | ✅ |
| 3 | WireGuard tunnel | ping -c 3 10.0.0.1 from Pi 3B+ | ✅ 0% loss |
| 4 | Pi-hole DNS | nslookup google.com 192.168.1.10 | ✅ Resolves |
| 5 | Hetzner VPS | ssh root@<HETZNER_IP> | ✅ |
| 6 | Wazuh Manager | systemctl status wazuh-manager | ✅ Active |
| 7 | Wazuh Agent | /var/ossec/bin/agent_control -l | ✅ argus-edge-01: Active |
| 8 | Suricata | systemctl status suricata | ✅ Active |
| 9 | Zeek | /opt/zeek/bin/zeekctl status | ✅ standalone running |
| 10 | SPAN working | tcpdump -i eth1 host 192.168.1.10 | ✅ Sees other hosts |
| 11 | Metasploitable 2 | nmap -p 21 192.168.1.10 | ✅ vsftpd 2.3.4 |
| 12 | DVWA | curl -I http://192.168.1.10:8080 | ✅ HTTP 200 |
| 13 | Pi 3B+ memory | htop on Pi 3B+ | ✅ Under 900MB |
Current Architecture — Fully Operational
1
2
3
4
5
6
7
8
9
10
11
12
13
14
15
16
17
18
19
20
21
22
Hetzner VPS (argus-soc) — Helsinki
  Wazuh Manager + Indexer + Dashboard
  ↑ Wazuh Agent telemetry (direct internet, port 1514)

Pi 5 (argus-central) — 192.168.1.10
  Pi-hole DNS
  WireGuard VPN Server (10.0.0.1)
  Metasploitable 2 + DVWA (Docker — start only when testing)

Pi 3B+ (argus-edge-01) — 192.168.1.20
  eth0 → Cisco SG300 GE1 (main connectivity)
  eth1 → Cisco SG300 GE2 (SPAN — all network traffic mirrored here)
  Wazuh Agent → Hetzner
  Suricata NIDS (eth1, ET Open 49,325 rules)
  Zeek (eth1, protocol metadata)

Cisco SG300-10MP — 192.168.1.2
  GE1  → Pi 3B+ eth0
  GE2  → Pi 3B+ eth1 (SPAN destination)
  GE5  → Pi 5
  GE10 → Router uplink
  SPAN: GE1 + GE5 + GE10 → GE2
What’s Next — Phase 1
With Phase 0 complete, Phase 1 builds the intelligence layer:
- n8n on Hetzner — workflow automation engine, co-located with Wazuh
- Claude API triage pipeline — every Wazuh alert gets classified by AI: severity, MITRE technique, plain-English summary
- Telegram Bot — operator notifications for medium and critical alerts
- PagerDuty — automated escalation chain for critical unacknowledged alerts (EU instance)
Every alert Suricata generates will flow through Wazuh to n8n, get triaged by Claude, and land as a formatted Telegram message. The detection stack goes live in Phase 1.
Part of the Argus SOC build series.