Building Argus SOC | Phase 4 Scenario 1 | Reconnaissance — Nmap vs the Detection Stack
Phase 4 Scenario 1 of the Argus SOC build — running aggressive and stealth Nmap scans against the lab, analyzing what the detection stack caught and what it missed, then fixing the root cause and re-testing.

📌 Author’s note — This post documents the Argus SOC lab at the time of publication, when the Pi 3B+ served as the MSSP edge sensor and the Pi 5 hosted the vulnerable Docker targets. The architecture was redesigned in Phase 5, which introduced a ThinkCentre M920x running Proxmox with an Active Directory lab as the client infrastructure, and moved the edge-sensor role onto the Pi 5. The detection logic, custom rules, and gap analysis described here remain valid; only the host topology has changed.
Build carried out on real hardware in a controlled home lab. Claude (Anthropic) was used as a reasoning and writing assistant — all deployments, attacks, configurations, and verifications were performed by the author.
Overview
Phase 4 is the red team phase — five attack scenarios run from Kali Linux against the lab infrastructure, with every detection result documented honestly. This first scenario covers network reconnaissance with Nmap: an aggressive scan and a stealth scan, followed by detection gap analysis, remediation, and re-testing.
Before any attacks ran, a pre-flight check uncovered three pipeline issues that needed fixing. Those are documented at the end of this post since anyone following the build would hit the same problems.
The Target
The Pi 5 (argus-central, 192.168.1.10) runs Metasploitable 2 and DVWA in Docker alongside its legitimate services. From the attacker’s perspective, this is a single host with a large attack surface — they don’t know which services are honeypots, which are real, and which are intentionally vulnerable.
The Pi 3B+ (argus-edge-01) monitors everything via SPAN port mirroring through the Cisco SG300.
Aggressive Scan
Timestamp: 2026-04-04 10:33 UTC
Command: nmap -sS -sV -O -A -T4 192.168.1.10
Duration: ~195 seconds
Nmap discovered 12 open services across the target:
| Port | Service | Source |
|---|---|---|
| 21 | vsftpd 2.3.4 (anonymous FTP) | Metasploitable 2 |
| 23 | Linux telnetd | Metasploitable 2 |
| 53 | dnsmasq / Pi-hole | Pi 5 native |
| 80/443 | Pi-hole web admin | Pi 5 native |
| 1524 | ingreslock backdoor | Metasploitable 2 |
| 2222 | OpenSSH 9.2p1 | Pi 5 native |
| 3000 | Grafana | Pi 5 native |
| 3306 | MySQL 5.0.51a | Metasploitable 2 |
| 5432 | PostgreSQL 8.3 | Metasploitable 2 |
| 6667 | UnrealIRCd 3.2.8.1 | Metasploitable 2 |
| 8080 | DVWA (Apache 2.4.66) | Docker |
| 8888 | MediaMTX | Pi 5 native |
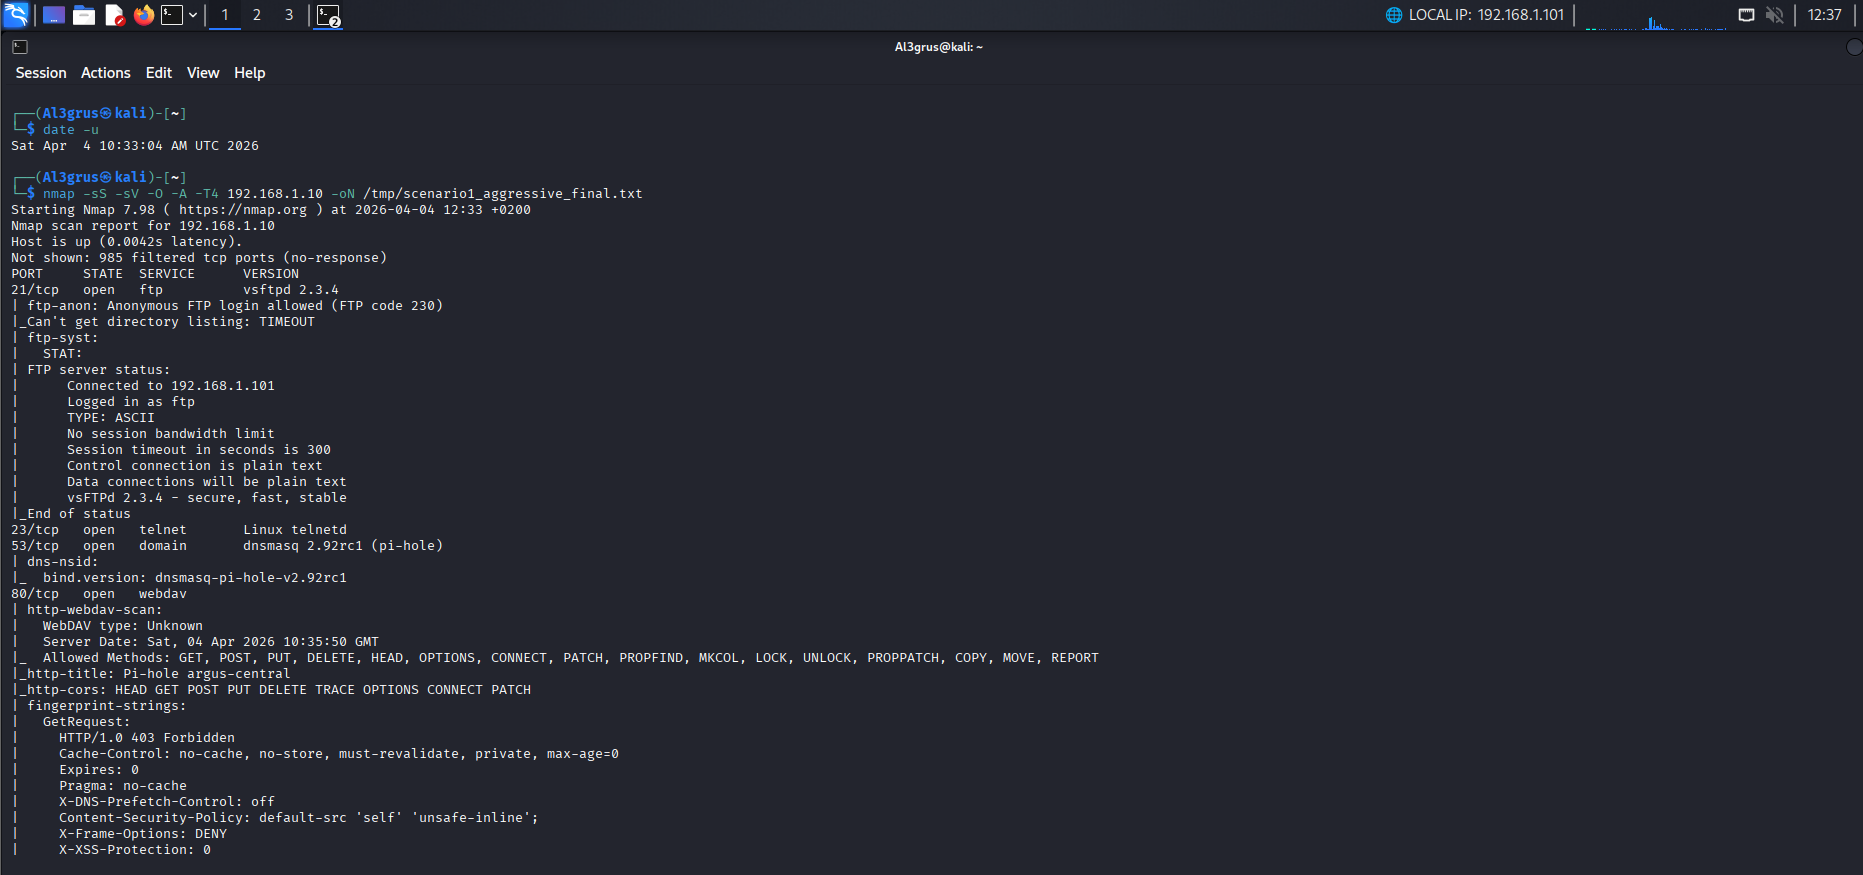 Nmap aggressive scan — 12 services discovered on argus-central
What the SOC saw
149 alerts fired across the detection stack. The Grafana dashboard showed a clear spike in the alert timeline, with protocol anomaly alerts dominating.
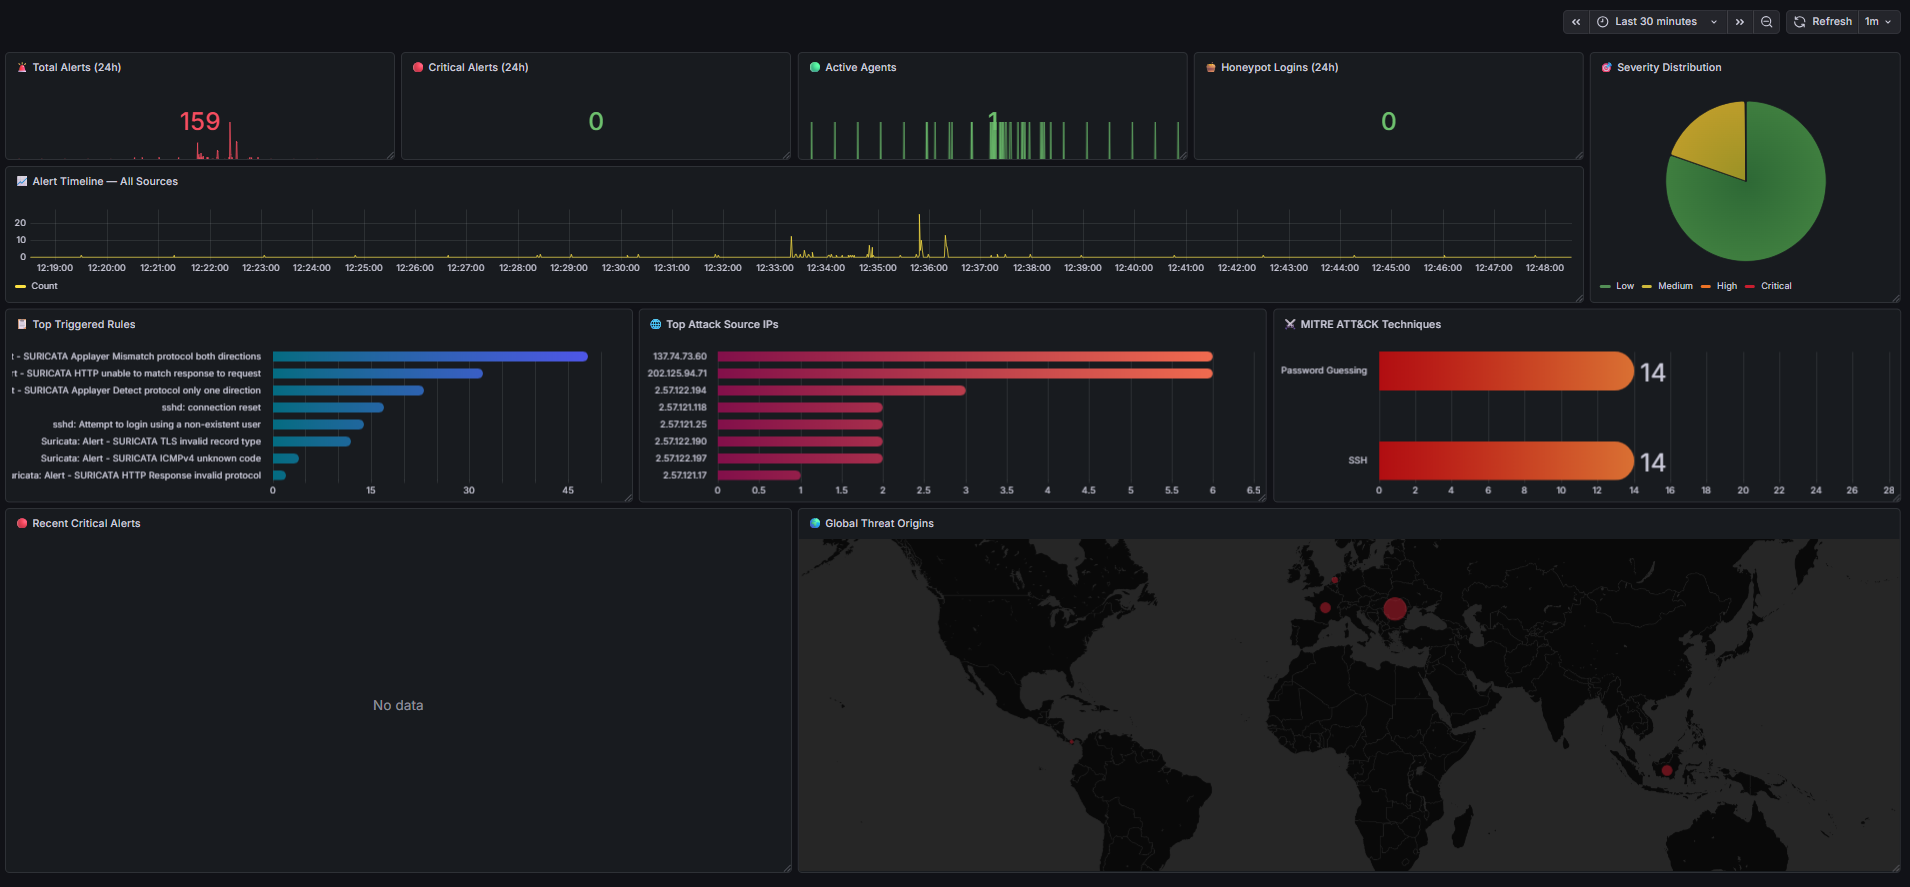 Grafana SOC dashboard — alert spike visible during the aggressive scan
The alert breakdown:
| Alert Signature | Count | Type |
|---|---|---|
| SURICATA Applayer Mismatch protocol both directions | 48 | Protocol anomaly |
| SURICATA HTTP unable to match response to request | 32 | Protocol anomaly |
| SURICATA Applayer Detect protocol only one direction | 23 | Protocol anomaly |
| SURICATA TLS invalid record type | 12 | Protocol anomaly |
| SURICATA ICMPv4 unknown code | 4 | Protocol anomaly |
| ET CHAT IRC NICK/USER command | 2 | Signature match |
| Other HTTP anomalies | 4 | Protocol anomaly |
| ET SCAN rules | 0 | None fired |
Suricata detected the scan through protocol-level side effects — nmap’s aggressive service probes confused application-layer parsers, generating dozens of “Mismatch” and “unable to match” alerts. But no ET SCAN rules fired. Suricata knew something unusual was happening but never explicitly identified it as a port scan.
All 149 alerts arrived at n8n via the Wazuh webhook. The pre-filter correctly dropped them as level 3 (below the level 10 threshold for Claude API triage). Telegram stayed quiet — noise filtering working as designed.
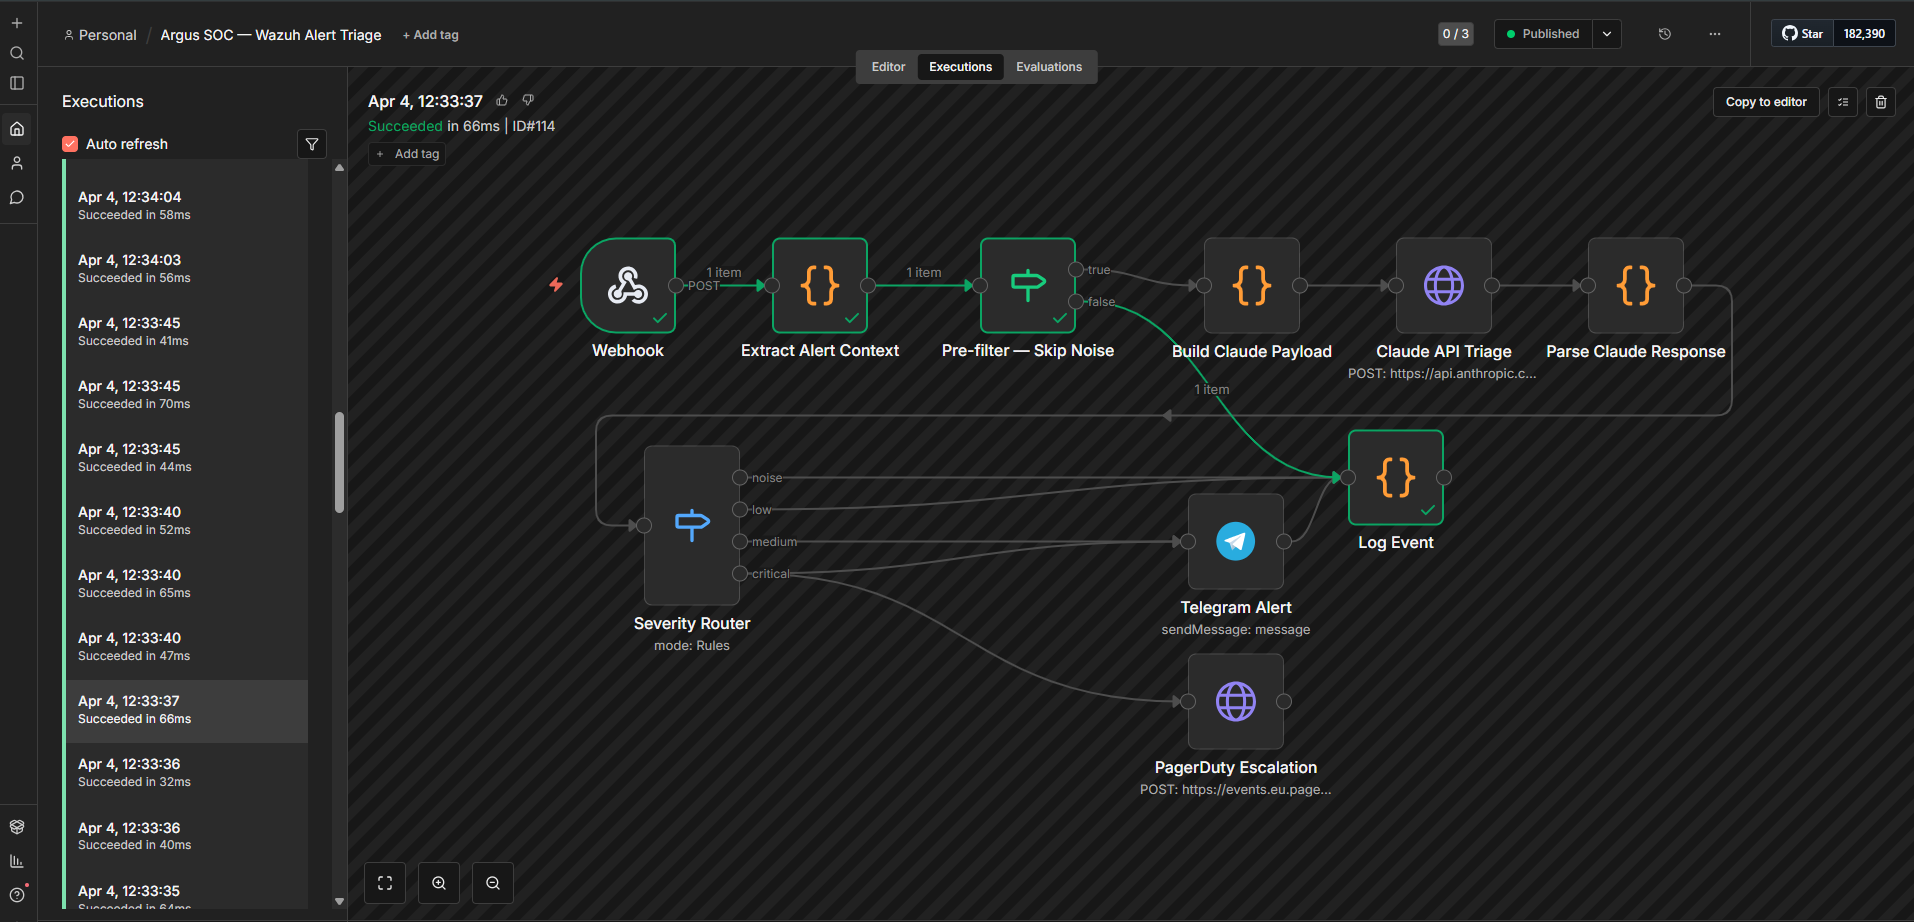 n8n executions — all alerts received, pre-filter dropping noise correctly
Stealth Scan
Timestamp: 2026-04-04 10:51 UTC
Command: nmap -sS -T1 -Pn --max-retries 1 --scan-delay 5s 192.168.1.10 -p 21,22,23,80,443,3306,8080
Duration: ~47 seconds
Alerts generated: 0
The stealth scan was completely invisible to the entire detection stack — zero Suricata alerts, zero Wazuh alerts, nothing on Grafana. A real attacker using slow timing would map this network’s key services without triggering a single alert.
| Metric | Aggressive Scan | Stealth Scan |
|---|---|---|
| Suricata alerts | 149 | 0 |
| Wazuh alerts from scan | 125+ | 0 |
| Scan detected | Yes (protocol anomalies) | No |
| Ports found | 15 (full surface) | 7 (targeted) |
This validates the MITRE coverage table: T1046 — High confidence (aggressive) / Low confidence (stealth). Stealth scans are an inherent limitation of signature-based NIDS. Without anomaly-based detection or statistical baselining, slow scans blend into normal traffic. In enterprise environments, this is addressed with NetFlow analysis, UEBA, or EDR-level telemetry — none of which are in scope for this homelab. Documenting the limitation is more useful than pretending it can be fixed with a rule.
Detection Gap: No ET SCAN Rules
The MITRE coverage table predicted “Suricata ET SCAN + Zeek conn.log” as the primary detection. But zero ET SCAN signatures fired — not one ET SCAN Nmap, ET SCAN Potential Port Scan, or any scan-specific rule.
The root cause was discovered later during Scenario 3: the HOME_NET variable in Suricata was set to 192.168.10.0/24 instead of 192.168.1.0/24 — a lapse from initially in the project having pi3b+ sitting at ‘192.168.10.20’, and only recently changing it to ‘192.168.1.20’ . Every ET rule referencing $HOME_NET or $EXTERNAL_NET had been misconfigured. The entire lab subnet was classified as external traffic.
Remediation
Fix 1 — HOME_NET Correction
On Pi 3B+ in /etc/suricata/suricata.yaml:
1
2
3
4
5
# Before — typo from Phase 0
HOME_NET: "[192.168.10.0/24]"

# After
HOME_NET: "[192.168.1.0/24]"
This single-character fix affected every Suricata rule using network variables. It was applied during Scenario 3 and retroactively fixed detection for all scenarios.
Fix 2 — Scan Frequency Correlation Rule
On Hetzner in /var/ossec/etc/rules/local_rules.xml:
1
2
3
4
5
6
<rule id="100031" level="10" frequency="20" timeframe="60">
  <if_matched_sid>86601</if_matched_sid>
  <same_source_ip/>
  <description>Suricata: Possible network scan detected — $(data.srcip) generated 20+ alerts in 60 seconds</description>
  <mitre><id>T1046</id></mitre>
</rule>
This rule escalates to level 10 when the same source IP generates 20+ Suricata alerts in 60 seconds — a scan pattern.
Re-Test Results
Timestamp: 2026-04-04 16:45 UTC
Same command: nmap -sS -sV -O -A -T4 192.168.1.10
| Metric | Before (HOME_NET wrong) | After (HOME_NET fixed) |
|---|---|---|
| Total alerts | 149 | 332 |
| ET SCAN Possible Nmap User-Agent Observed | 0 | 199 |
| Applayer Mismatch | 48 | 48 |
| Scan explicitly identified as nmap | No | Yes |
The ET SCAN signature now fires 199 times, correctly identifying the nmap scan by its User-Agent string. The scan is no longer just “something weird” — it’s explicitly labelled as nmap reconnaissance.
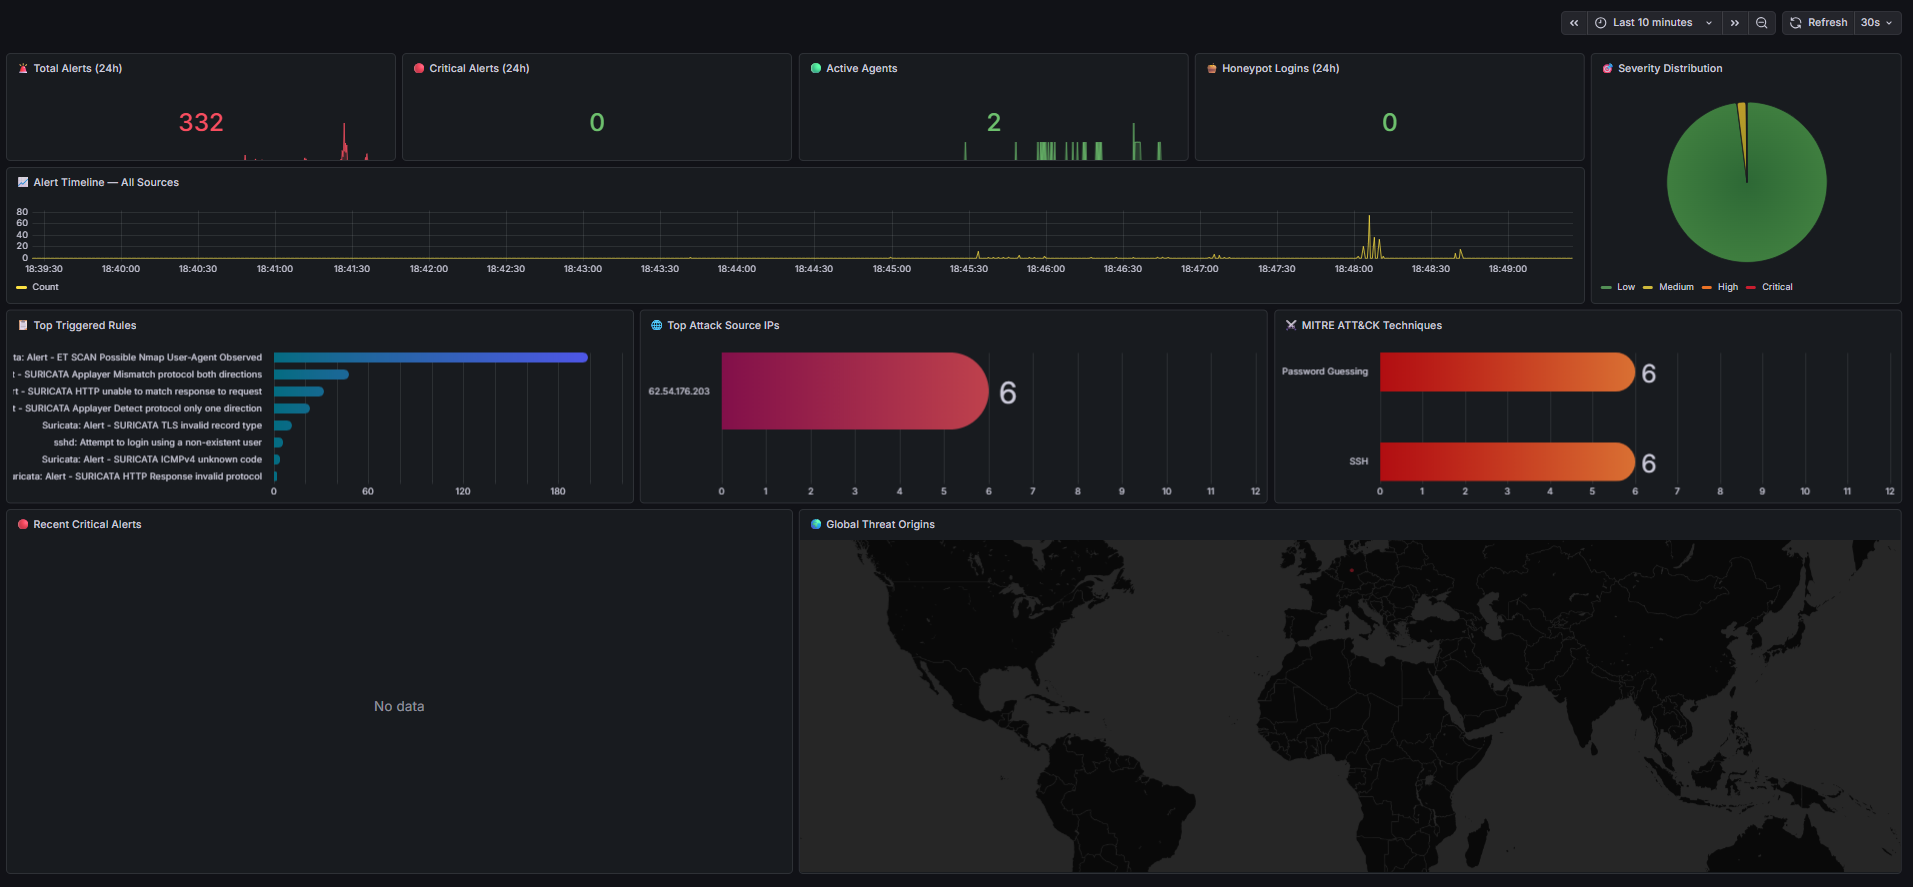 Grafana after HOME_NET fix — “ET SCAN Possible Nmap User-Agent Observed” is now the top triggered rule
Remaining Gap
All alerts remain level 3 (Wazuh rule 86601 generic Suricata wrapper). The frequency correlation rule (100031) did not fire — the <same_source_ip/> tag cannot extract source IPs from Suricata’s nested JSON format within the generic wrapper. The scan is now detected and labelled, but does not escalate to Telegram. This remains a tuning opportunity.
Pipeline Fixes (Pre-Flight)
Three issues were discovered and fixed during pre-flight testing before Phase 4 began:
1. Wazuh integratord stale config — ossec.conf was changed from webhook level 10 to level 3, but wazuh-manager needed a full restart for integratord to pick up the new config. A systemctl restart wazuh-manager resolved it.
2. n8n Pre-filter expression error — the IF node had the entire expression ` >= 10 baked into the value field. The correct configuration is three separate fields in the n8n UI: Value 1 = , Operation = Greater than or equal, Value 2 = 10`. The operator and comparison value must be set separately using n8n’s built-in condition UI.
3. n8n Log Event node crash — the Log Event code node referenced $('Parse Claude Response') which throws an error when alerts arrive from the pre-filter false path (where Claude was never called). Fixed with a nested try/catch that handles all three input paths — see the Phase 1 post for the updated code.
Current State
| Detection | Result |
|---|---|
| Aggressive scan detected | Yes — 332 alerts, ET SCAN correctly identifies nmap |
| Stealth scan detected | No — inherent NIDS limitation |
| Claude classification | Not reached (level 3 alerts) |
| Telegram notification | No |
| HOME_NET fixed | Yes — affects all scenarios |
What’s Next — Scenario 2
Scenario 2 tests the full pipeline end-to-end with a credential brute force attack: Hydra against the Cowrie SSH honeypot on Pi 3B+. Unlike Scenario 1 where all alerts were filtered as noise, the Cowrie honeypot login rules fire at level 10 — high enough to pass the pre-filter, reach Claude, and trigger Telegram.
Part of the Argus SOC build series.